
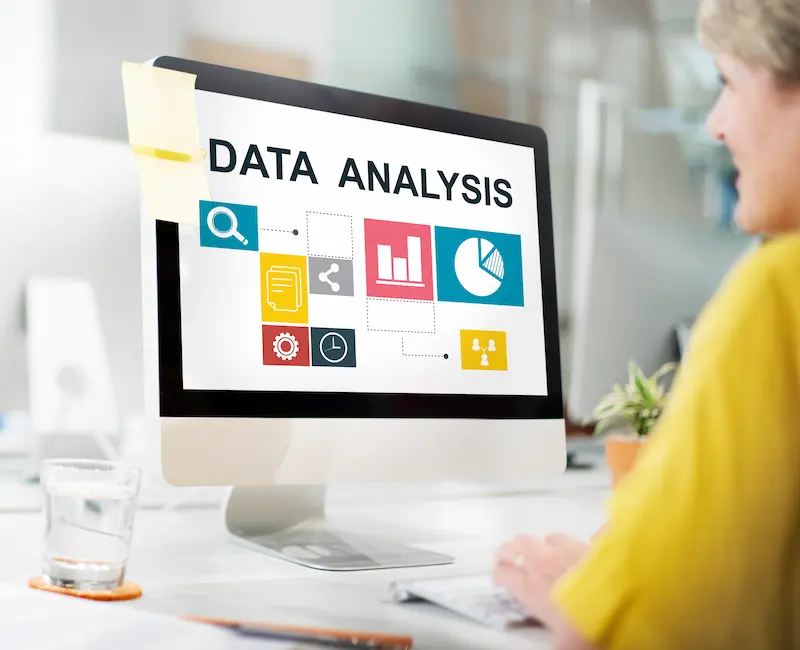
In today’s data-driven landscape, the ability to analyse and interpret data is more crucial than ever. Whether you’re a business owner, a data analyst, or someone looking to make informed decisions, leveraging the right data analysis tools can significantly enhance your ability to extract meaningful insights. These tools transform raw data into actionable information, enabling you to make decisions that are both timely and accurate.
With an ever-growing array of options available, selecting the appropriate tool can be daunting. This guide aims to provide clarity by exploring the top data analysis tools in 2025, highlighting their features, advantages, and ideal use cases.
Table of Contents
What Are Data Analysis Tools?
Data analysis tools are software applications designed to process, analyse, and visualise data. They assist users in transforming raw data into meaningful insights through various methods, including statistical analysis, data visualisation, and predictive modelling.
These tools cater to a wide range of users, from beginners seeking intuitive interfaces to advanced users requiring robust analytical capabilities. The primary goal is to facilitate data-driven decision-making by making complex data more accessible and understandable.
Top Data Analysis Tools in 2025

In 2025, businesses and analysts will have access to a wide range of data analysis tools that simplify data processing and visualisation. Choosing the right tool can help turn raw data into actionable insights quickly and efficiently.
1. Microsoft Excel
Microsoft Excel is one of the most widely used data analysis tools, thanks to its versatility and ease of use. It allows you to manage small to medium datasets efficiently and provides basic analytical capabilities without requiring advanced technical knowledge. Features like pivot tables, charts, and conditional formatting make it easy to summarise and visualise data.
Excel is not limited to simple calculations. With formulas, macros, and add-ins, you can perform complex statistical analysis, automate repetitive tasks, and even connect to external databases. For professionals in finance, marketing, and project management, Excel remains a reliable tool for reporting and data organisation.
Best Use For: Financial analysis, sales tracking, project reporting, and small to medium-sized datasets that require quick calculation and visualisation.
2. Tableau
Tableau is a leading data visualisation tool that helps you turn complex datasets into interactive dashboards. Its drag-and-drop interface allows users to create charts, graphs, and visual reports without extensive programming knowledge. With Tableau, you can quickly spot trends and patterns, making it easier to communicate insights to stakeholders.
One of Tableau’s key strengths is real-time data analysis. You can connect to multiple data sources, including databases and cloud services, to visualise live data instantly.
Best Use For: Businesses and analysts needing interactive dashboards, visual storytelling, and real-time insights across industries like finance, retail, and healthcare.
3. Python (with Pandas and NumPy)
Python has become a favourite among data analysts and data scientists because of its flexibility and extensive libraries. Libraries like Pandas and NumPy allow you to clean, manipulate, and analyse large datasets efficiently. Python is ideal for statistical analysis, automation, and building predictive models.
Unlike spreadsheet tools, Python can handle datasets of virtually any size, making it suitable for big data projects. Its ability to integrate with machine learning frameworks also adds value if you are interested in predictive analytics.
Best Use For: Data scientists and analysts performing advanced statistical analysis, automation, and handling large-scale or complex datasets.
4. R Programming
R is a statistical computing language widely used in academia and research. It provides extensive packages for data analysis, visualisation, and statistical modelling. Analysts can perform tasks like regression analysis, hypothesis testing, and clustering.
R is favoured for its visualization capabilities. Libraries like ggplot2 allow you to create publication-quality charts and graphs. It is highly extensible, supporting custom packages for specialised analysis.
Best Use For: Researchers, statisticians, and professionals needing advanced statistical modeling and high-quality data visualization.
5. Microsoft Power BI
Microsoft Power BI is a business intelligence tool that allows you to create interactive reports and dashboards. It integrates seamlessly with other Microsoft products like Excel and Azure, making it easier to work with existing data sources.
Power BI offers features such as data modeling, real-time analytics, and AI-driven insights. Its drag-and-drop interface ensures even non-technical users can build insightful dashboards.
Best Use For: Businesses that require comprehensive reporting, real-time monitoring of KPIs, and integration with Microsoft services.
6. Google Sheets
Google Sheets is a cloud-based spreadsheet tool with real-time collaboration features. Multiple users can work on the same sheet simultaneously, making it ideal for teams and small businesses.
Beyond basic spreadsheet functions, Google Sheets supports add-ons and scripts that can automate data analysis tasks. It integrates well with other Google Workspace apps and external data sources.
Best Use For: Small businesses, teams, or individuals needing collaborative data management and basic analysis without complex software.
7. Apache Hadoop
Apache Hadoop is designed for processing large datasets across distributed computing environments. It provides reliable, scalable storage and processing capabilities, making it suitable for big data projects.
Hadoop’s framework allows analysts to store massive amounts of structured and unstructured data while performing parallel computations. It is highly efficient for industries handling enormous datasets.
Best Use For: Large enterprises handling big data across e-commerce, finance, healthcare, or any sector requiring distributed storage and processing.
8. Alteryx
Alteryx is a data blending and advanced analytics platform that combines preparation, analysis, and reporting in one interface. It features a drag-and-drop system, reducing the need for heavy coding knowledge.
The software supports predictive analytics, spatial analysis, and data cleansing. Analysts can blend data from multiple sources, automate workflows, and generate actionable insights efficiently.
Best Use For: Organisations aiming to streamline data preparation, perform predictive modelling, and deliver actionable business insights quickly.
How to Choose the Right Data Analysis Tool
Selecting the appropriate data analysis tool depends on various factors:
- Data Complexity: For basic tasks, tools like Excel or Google Sheets suffice. For complex analyses, consider Python, R, or Alteryx.
- Team Collaboration: If multiple users need to access and work on data simultaneously, cloud-based tools like Google Sheets or Power BI are beneficial.
- Integration Needs: Ensure the tool integrates well with your existing systems and data sources.
- Budget: Consider the cost of the tool and whether it fits within your organisation’s budget constraints.
Assessing these factors will help determine the most suitable tool for your specific needs.
Wrapping Up
In conclusion, selecting the right data analysis tool is crucial for effectively interpreting data and making informed decisions. Each tool offers unique features tailored to different needs and expertise levels. By understanding the strengths and applications of each, you can choose the one that best aligns with your requirements.
Remember, the most effective tool is one that integrates seamlessly into your workflow, enhances your analytical capabilities, and supports your decision-making processes. Stay informed about the latest developments in data analysis tools to ensure you continue to leverage the best resources available.
Frequently Asked Questions (FAQs)
Q1. What is the best data analysis tool for beginners?
For beginners, Microsoft Excel and Google Sheets are excellent starting points due to their user-friendly interfaces and widespread usage.
Q2. Can I use Python for data analysis without programming experience?
While Python offers powerful data analysis capabilities, a basic understanding of programming is beneficial. However, many resources are available to help beginners learn Python for data analysis.
Q3. Is Tableau suitable for small businesses?
Yes, Tableau offers scalable solutions that can cater to the needs of small businesses, providing them with advanced data visualisation tools.
Q4. How does R compare to Python in data analysis?
Both R and Python are powerful tools for data analysis. R is particularly strong in statistical analysis and visualisation, while Python offers versatility and is widely used in data science and machine learning.
Q5. Are there free data analysis tools available?
Yes, tools like Google Sheets, Python, and R are free to use and offer robust data analysis capabilities.
RELATED ARTICLES


Latest Articles
 Fast, compliant global background screen…In Tech Startups
 Balancing Investment and Protection with…In Insurance
 Japan Tour Packages for Travellers Who W…In Tips
 Getting What You Need: Align Your Action…In General
 Preventing Dust Damage With Proper Lapto…In Gadgets
 Simplifying Lawn Equipment Care with Com…In Tips
 What Is the Meaning of Life: Philosophic…In General
 The Ultimate Home Improvement Checklist …In Tips